2023. 3. 2. 17:49ㆍ기술 공부/Seaborn
+ Seaborn의 User guide and tutorial를 필사한 내용입니다.
+ 실행 환경은 Anaconda, IPython, Jupyter NoteBook 입니다.
이번 주제는,
'Data structures accepted by seaborn' 이다.
번역하자면,
'seaborn에서 허용하는 데이터 구조' 이다.
이 글에서 다룰 파트는,
- Options for visualizing long-form data, 긴 형식의 데이터를 시각화하기 위한 옵션
- Options for visualizing wide-form data, 넓은 형식의 데이터를 시각화하기 위한 옵션
이다.
바로 시작해보자.
Options for visualizing long-form data
: 긴 형식의 데이터를 시각화하기 위한 옵션
긴 형식의 데이터에는 정확한 정의가 있지만 seaborn은 실제로 메모리의 데이터 구조 전체에서 구성되는 방식 측면에서 상당히 유연합니다. 문서의 나머지 부분에 있는 예제에서는 일반적으로 플롯의 변수에 해당 열의 이름을 할당하여 pandas.DataFrame 개체 및 참조 변수를 사용합니다. 그러나 Python 사전 또는 해당 인터페이스를 구현하는 클래스에 벡터를 저장하는 것도 가능합니다.
While long-form data has a precise definition, seaborn is fairly flexible in terms of how it is actually organized across the data structures in memory. The examples in the rest of the documentation will typically use pandas.DataFrame objects and reference variables in them by assigning names of their columns to the variables in the plot. But it is also possible to store vectors in a Python dictionary or a class that implements that interface:
긴 형식의 데이터(Long-form data)에는 분명한 장점이 있지만,
Seaborn에서는 실제로 메모리에 저장된 데이터 구조가 구성되는 방식에 대해 굉장히 관대하다는 말인 것 같다.
즉, 긴 형식의 데이터프레임만 아니라, 다른 형태의 데이터도 지원한다는 내용인 것 같다.
예시 코드를 봐보자.
flights = sns.load_dataset('flights')
flights_dict = flights.to_dict()
print(flights_dict)
데이터프레임이 Python Dictionary Type으로 선언된 모습이다.
이 Dictionary를 가지고 시각화를 해보자.
sns.relplot(
    data=flights_dict,
    x='year',
    y='passengers',
    hue='month',
    kind='line'
);
훌륭하게 시각화되었다.
group-by의 split-apply-combine 작업과 같은 많은 pandas 작업은 정보가 입력 데이터 프레임의 열에서 출력 인덱스로 이동한 데이터 프레임을 생성합니다. 이름이 유지되는 한 여전히 정상적으로 데이터를 참조할 수 있습니다.
Many pandas operations, such as the split-apply-combine operations of a group-by, will produce a dataframe where information has moved from the columns of the input dataframe to the index of the output. So long as the name is retained, you can still reference the data as normal:
뭔가 복잡하게 설명되어 있지만,
단순화 해보자면 데이터를 변형해도, 변수가 index와 column에 존재한다면 그대로 사용할 수 있다는 의미인 것 같다.
예시 코드를 봐보자.
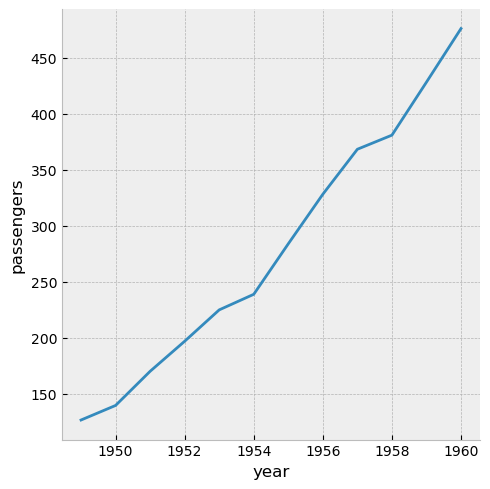
flights_avg = flights.groupby('year').mean()sns.relplot(
data=flights_avg,
x='year',
y='passengers',
kind='line'
);
기존의 데이터프레임에서 가져온 year 변수를
새로운 데이터프레임에 저장하고, year 변수를 그대로 사용해 시각화를 하였다.
또한 데이터 벡터를 x, y 및 기타 플로팅 변수에 대한 인수로 직접 전달할 수 있습니다. 이러한 벡터가 pandas 개체인 경우 이름 특성을 사용하여 플롯에 레이블을 지정합니다.
Additionally, it’s possible to pass vectors of data directly as arguments to x, y, and other plotting variables. If these vectors are pandas objects, the name attribute will be used to label the plot:
추가적으로, x, y 파라미터에 변수명이 아닌, 실제 데이터를 전달하여 시각화를 할 수 있다고 한다.
예시 코드를 봐보자.
year = flights_avg.index평균의 인덱스를 year 변수에 담았다.
passengers = flights_avg['passengers']flights_avg 데이터프레임에서 passengers 변수가 가지고 있는 데이터들을 passengers 변수에 담았다.
sns.relplot(
    x=year,
    y=passengers,
    kind='line'
);
훌륭하게 시각화되었다.
Python 시퀀스 인터페이스를 구현하는 Numpy 배열 및 기타 개체도 작동하지만 이름이 없으면 추가 조정 없이 플롯이 유익하지 않습니다.
Numpy arrays and other objects that implement the Python sequence interface work too, but if they don’t have names, the plot will not be as informative without further tweaking:
마지막으로 numpy array, list를 사용할 수도 있다고 한다.
하지만, 이렇게 되면 변수명이 없기 때문에 시각화에서는 유익하지 않다고 한다.
예시 코드를 봐보자.
sns.relplot(
    x=year.to_numpy(),
    y=passengers.to_list(),
    kind='line'
);
data 파라미터가 사용되지 않았다.

x, y 축의 label 이 모두 사라져버렸다. 시각화에선 이렇게 사용하는 것은 상당히 비효율적일 것 같다.
물론 이런 방법도 있다는 것은 알아두자.
Options for visualizing wide-form data
: 넓은 형식의 데이터를 시각화하기 위한 옵션
넓은 형식의 데이터를 전달하는 옵션은 훨씬 더 유연합니다. 긴 형식의 데이터와 마찬가지로 이름(경우에 따라 색인) 정보를 사용할 수 있기 때문에 pandas 개체가 선호됩니다. 그러나 본질적으로 단일 벡터 또는 벡터 모음으로 볼 수 있는 모든 형식을 데이터로 전달할 수 있으며 일반적으로 유효한 플롯을 구성할 수 있습니다.
위에서 본 예에서는 직사각형의 pandas.DataFrame을 사용했으며, 이는 해당 열의 모음으로 생각할 수 있습니다. Pandas 개체의 사전 또는 목록도 작동하지만 축 레이블이 손실됩니다.
The options for passing wide-form data are even more flexible. As with long-form data, pandas objects are preferable because the name (and, in some cases, index) information can be used. But in essence, any format that can be viewed as a single vector or a collection of vectors can be passed to data, and a valid plot can usually be constructed.
The example we saw above used a rectangular pandas.DataFrame, which can be thought of as a collection of its columns. A dict or list of pandas objects will also work, but we’ll lose the axis labels:
넓은 형식의 데이터(Wide-form data)의 경우, 데이터를 훨씬 더 유연하게 처리할 수 있다고 한다.
예시 코드를 봐보자.
예제 데이터 셋인 flights를 넓은 형식의 데이터(Wide-form data)로 변환해주었다.
flights_wide = flights.pivot(index='year', columns='month', values='passengers')
flights_wide
그 후, 한 column에 해당하는 Series로 나누어 Python List에 담아주었다.
flights_wide_list = [col for _, col in flights_wide.items()]
flights_wide_list[0]
sns.relplot(
    data=flights_wide_list,
    kind='line'
);
훌륭하게 그려졌다.
컬렉션의 벡터는 길이가 같을 필요가 없습니다. 색인이 있으면 정렬하는 데 사용됩니다.
The vectors in a collection do not need to have the same length. If they have an index, it will be used to align them:
이러한 Vector(Series 등)의 길이는 같을 필요가 없다고 한다.
예시 코드를 봐보자.
two_series = [flights_wide.loc[:1955, 'Jan'], flights_wide.loc[1952:, 'Aug']]이번에는 한 Series는 처음부터 1955년까지만, 다른 Series는 1952년부터 끝까지 가져오도록 했다.
길이가 다르다는 것이 포인트이다.
sns.relplot(
    data=two_series,
    kind='line'
);
Series가 가지고 있는 데이터까지만 시각화가 되었다. 이러한 옵션은 개인적인 생각으로 조금 유용할 것 같다.
이러한 벡터의 사전은 최소한 키를 사용합니다.
But a dictionary of such vectors will at least use the keys:
긴 형식의 데이터(Long-form data)에서는 Dictionary Key 값이 숫자로 되어 있었으나,
넓은 형식의 데이터(Wide-form data)에서는 Key 값에 컬럼명이 들어가는 것을 말하고 있다.
예시 코드를 봐보자.
two_arrays_dict = {s.name: s.to_numpy() for s in two_series}sns.relplot(
data=two_arrays_dict,
kind='line'
);
직사각형 numpy 배열은 인덱스 정보가 없는 데이터 프레임처럼 취급되므로 열 벡터의 모음으로 간주됩니다. 이것은 단일 인덱서가 행에 액세스하는 numpy 인덱싱 작업의 작동 방식과 다릅니다. 그러나 pandas가 배열을 데이터 프레임으로 변환하는 방법 또는 matplotlib가 배열을 그리는 방법과 일치합니다.
Rectangular numpy arrays are treated just like a dataframe without index information, so they are viewed as a collection of column vectors. Note that this is different from how numpy indexing operations work, where a single indexer will access a row. But it is consistent with how pandas would turn the array into a dataframe or how matplotlib would plot it:
직사각형 numpy 배열은 넓은 형식의 데이터(Wide-form data)처럼 취급된다는 것 같다.
이 방식은 본래 numpy 배열의 작동 방식과는 다르고, pandas, matplotlib에서 numpy 배열을 다루는 방식과 같다고 한다.
예시 코드를 봐보자.
flights_array = flights_wide.to_numpy()
flights_array
쉽게 말해, 2차원 배열의 형태로 만들어진다는 말인 것 같다.
sns.relplot(
    data=flights_array,
    kind='line'
);
출처 :
User guide and tutorial — seaborn 0.12.2 documentation
https://seaborn.pydata.org/tutorial/data_structure.html#options-for-visualizing-long-form-data
Data structures accepted by seaborn — seaborn 0.12.2 documentation
Data structures accepted by seaborn As a data visualization library, seaborn requires that you provide it with data. This chapter explains the various ways to accomplish that task. Seaborn supports several different dataset formats, and most functions acce
seaborn.pydata.org
GitHub :
MoonsRainbow/seaborn-tutorial
https://github.com/MoonsRainbow/seaborn-tutorial
GitHub - MoonsRainbow/seaborn-tutorial: Seaborn User guide and tutorial 필사 코드입니다.
Seaborn User guide and tutorial 필사 코드입니다. Contribute to MoonsRainbow/seaborn-tutorial development by creating an account on GitHub.
github.com
'기술 공부 > Seaborn' 카테고리의 다른 글
| 12) The seaborn.objects interface (2) (0) | 2023.03.16 |
|---|---|
| 11) The seaborn.objects interface (1) (0) | 2023.03.09 |
| 9) Data structures accepted by seaborn (1) (1) | 2023.02.23 |
| 8) Figure-level vs. axes-level functions (3) (1) | 2023.02.21 |
| 7) Figure-level vs. axes-level functions (2) (0) | 2023.02.20 |