2023. 3. 9. 17:44ㆍ기술 공부/Seaborn
+ Seaborn의 User guide and tutorial를 필사한 내용입니다.
+ 실행 환경은 Anaconda, IPython, Jupyter NoteBook 입니다.
이번 주제는,
'The seaborn.objects interface' 이다.
번역하자면,
'seaborn.objects 인터페이스' 이다.
이 글에서 다룰 파트는,
'Specifying a plot and mapping data'
: 플롯 및 매핑 데이터 지정
이다.
이 글에서 다룰 소제목은,
- Setting properties,
:속성 설정 - Mapping properties,
:매핑 속성 - Defining groups,
:그룹 정의
이다.
바로 시작해보자.
The seaborn.objects interface
: seaborn.objects 인터페이스
seaborn.objects 네임스페이스는 seaborn 플롯을 만들기 위한 완전히 새로운 인터페이스로 버전 0.12에서 도입되었습니다. 데이터 변환 및 플로팅을 위한 구성 가능한 클래스 모음으로 구성된 보다 일관되고 유연한 API를 제공합니다. 기존 seaborn 기능과 달리 새로운 인터페이스는 matplotlib로 드롭다운하지 않고 종단 간 플롯 사양 및 사용자 지정을 지원하는 것을 목표로 합니다(필요한 경우 계속 가능함).
The seaborn.objects namespace was introduced in version 0.12 as a completely new interface for making seaborn plots. It offers a more consistent and flexible API, comprising a collection of composable classes for transforming and plotting data. In contrast to the existing seaborn functions, the new interface aims to support end-to-end plot specification and customization without dropping down to matplotlib (although it will remain possible to do so if necessary).
seaborn.objects는 seaborn 플롯을 만들기 위해 0.12 버전에서 도입되었다고 한다.
matplotlib으로 드롭다운 -
seaborn 사용 중, (불가피한, seaborn에서 지원하지 못하는 경우) matplotlib을 다뤄야하는 경우가 발생하는 것?
- 하지 않고 seaborn만을 사용해서 사용자가 원하는 플롯을 그릴 수 있도록 하는 것을 목표로 한다고 한다.
+ 추가로 실헙적이고 불완전한 단계이기 때문에, 아직까지 매끄럽게 정리되지 않았다고 한다.
+ 사용 중 무언가 부자연스럽거나, 이슈가 발생하면, GitHub을 통해 이슈 제보를 해보는 것도 괜찮을 것 같다.
Sepecifying a plot and mapping data
: 플롯 및 매핑 데이터 지정
개체 인터페이스는 다음 규칙에 따라 가져와야 합니다.
The objects interface should be imported with the following convention:
import seaborn.objects as so이번에는 정상적인 별칭이 붙었다.
seaborn.objects 네임스페이스는 모든 관련 클래스에 대한 액세스를 제공합니다. 가장 중요한 것은 플롯입니다. Plot 객체를 인스턴스화하고 해당 메서드를 호출하여 플롯을 지정합니다. 간단한 예를 살펴보겠습니다.
The seaborn.objects namespace will provide access to all of the relevant classes. The most important is Plot. You specify plots by instantiating a Plot object and calling its methods. Let’s see a simple example:
위에서 불러온 objects는 모든 클래스에 접근할 수 있다고 한다.
가장 중요한 플롯 인스턴스를 만들고 그 안의 메서드를 호출하는 예시를 봐보자.
penguins = sns.load_dataset('penguins')우선 사용할 예제 데이터 세트를 불러왔다.
plot_penguins = so.Plot(penguins, x='bill_length_mm', y='bill_depth_mm')objects로 Plot 인스턴스를 생성하고, plot_penguins에 담아주었다.
여기서 plt.show()를 호출하면, 빈 플롯만 그려진다.
plot_penguins.add(so.Dot())점을 찍어주도록 인스턴스 내부의 add 메서드를 통해 so.Dot()을 추가해주었다.
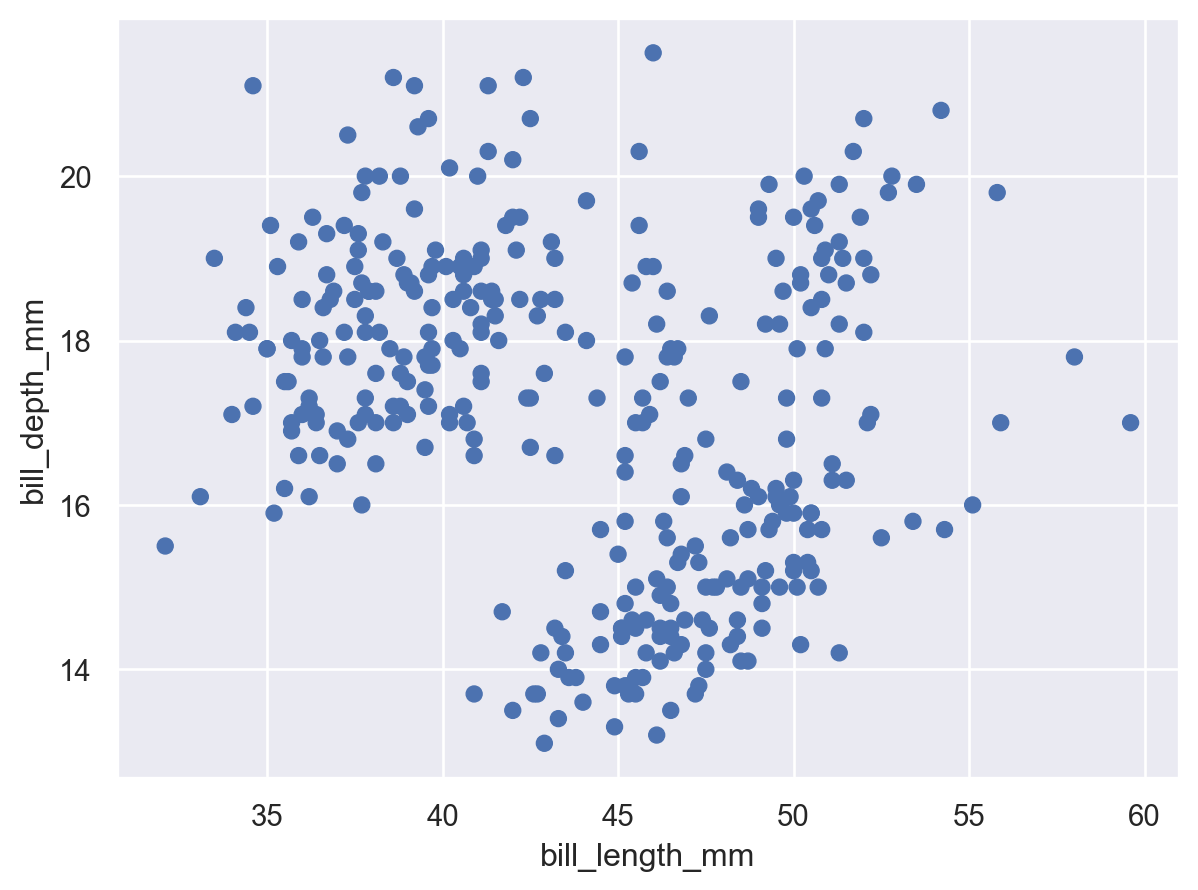
훌륭하게 그려졌다.
산점도를 생성하는 이 코드는 꽤 친숙하게 보일 것입니다. seaborn.scatterplot()을 사용할 때와 마찬가지로 깔끔한 데이터 프레임(펭귄)을 전달하고 해당 열 중 두 개를 플롯의 x 및 y 좌표에 할당했습니다. 그러나 차트 유형으로 시작한 다음 일부 데이터 할당을 추가하는 대신 여기서는 데이터 할당으로 시작한 다음 그래픽 요소를 추가했습니다.
This code, which produces a scatter plot, should look reasonably familiar. Just as when using seaborn.scatterplot(), we passed a tidy dataframe (penguins) and assigned two of its columns to the x and y coordinates of the plot. But instead of starting with the type of chart and then adding some data assignments, here we started with the data assignments and then added a graphical element.
동일한 결과물을 그리는 seaborn.scatterplot()과 다른 점을 설명하고 있다.
seaborn.scatterplot()의 경우,
차트 유형(scatterplot)으로 시작한 다음, 일부 데이터 할당(penguins)을 추가해주었다.
seaborn.objects()의 경우,
데이터 할당(penguins)으로 시작한 다음, 그래픽 요소(Dot)를 추가해주었다.
Setting properties
: 속성 설정
Dot 클래스는 데이터 값을 그래픽으로 나타내는 개체인 Mark의 예입니다. 각 마크에는 모양을 변경하기 위해 설정할 수 있는 여러 속성이 있습니다.
The Dot class is an example of a Mark: an object that graphically represents data values. Each mark will have a number of properties that can be set to change its appearance:
Dot 클래스는 점(Mark)을 나타낼 수 있는 예라고 한다.
또한 설정을 통해 점(Mark)의 모양도 변경할 수 있다고 한다.
위에서 생성한 plot_penguins 인스턴스를 그대로 다시 사용하였다.
plot_penguins.add(so.Dot(color='g', pointsize=4))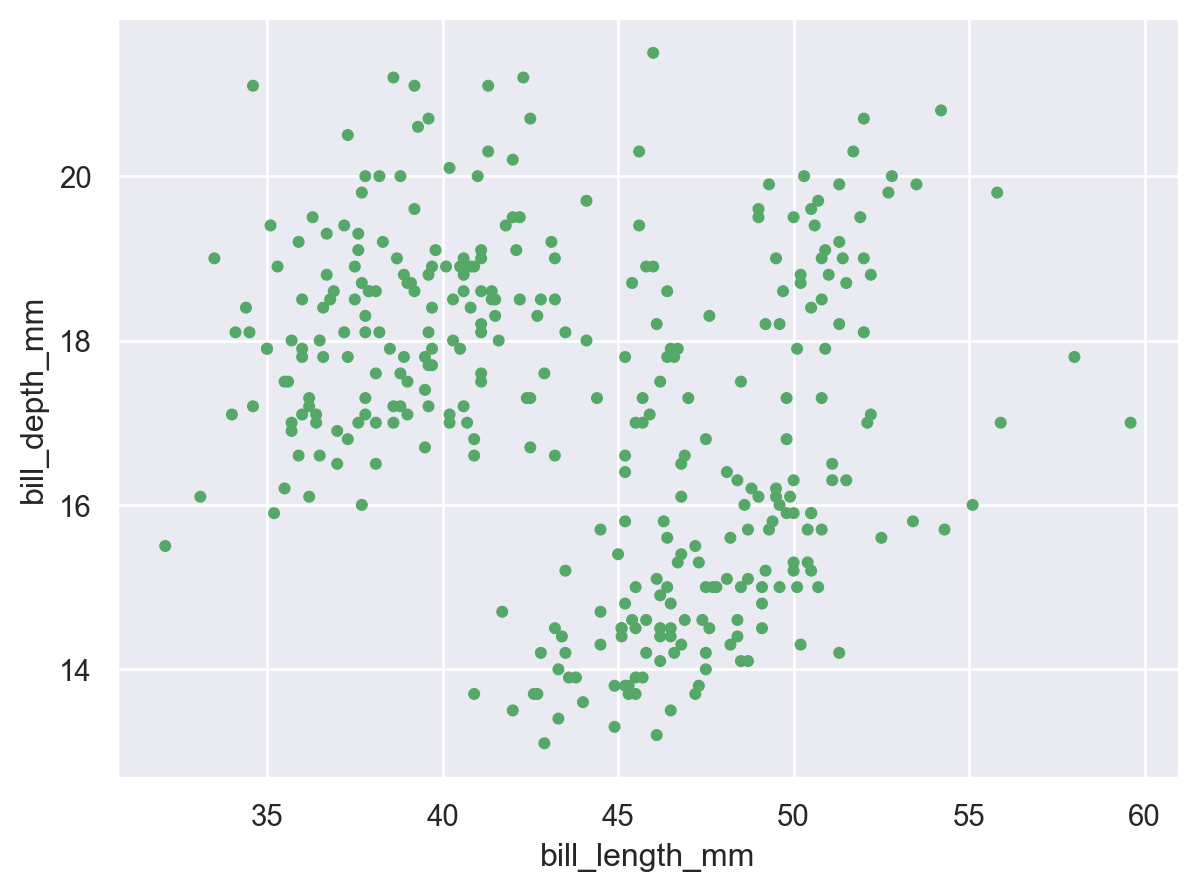
Mapping properties
: 속성 매핑
seaborn의 기능과 마찬가지로 데이터 값을 다양한 그래픽 속성에 매핑하는 것도 가능합니다.
As with seaborn’s functions, it is also possible to map data values to various graphical properties:
seaborn의 hue를 통해 범주형 데이터에 색상을 입힌 것 처럼,
objects에서도 가능하다고 한다.
plot_penguins = so.Plot(
    penguins,
    x='bill_length_mm',
    y='bill_depth_mm',
    color='species',
    pointsize='body_mass_g'
)
color 파라미터로 species 별로 색상을 입히도록 하였다.
plot_penguins.add(so.Dot())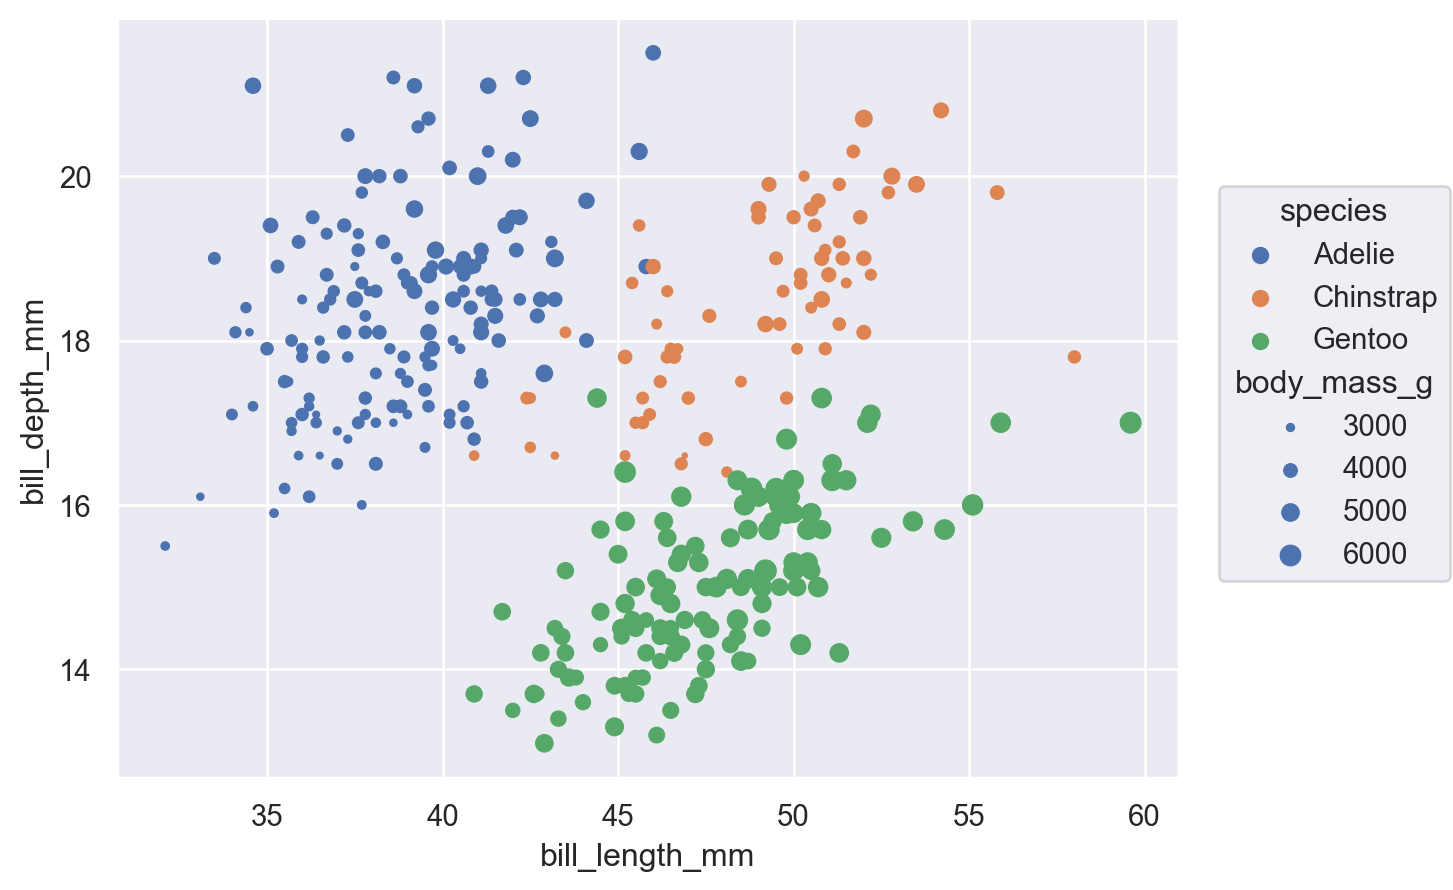
이 기본 기능이 새롭지는 않지만 함수 API와의 중요한 차이점은 속성을 직접 설정하는 동일한 매개 변수 이름을 사용하여 속성이 매핑된다는 것입니다(색상 대 색상 등이 있는 대신). 중요한 것은 속성이 정의된 위치입니다. Dot을 초기화할 때 값을 전달하면 값이 직접 설정되는 반면 Plot을 설정할 때 변수를 할당하면 해당 데이터가 매핑됩니다.
이러한 차이점 외에도 개체 인터페이스를 사용하면 훨씬 더 광범위한 마크 속성을 매핑할 수 있습니다.
While this basic functionality is not novel, an important difference from the function API is that properties are mapped using the same parameter names that would set them directly (instead of having hue vs. color, etc.). What matters is where the property is defined: passing a value when you initialize Dot will set it directly, whereas assigning a variable when you set up the Plot will map the corresponding data.
Beyond this difference, the objects interface also allows a much wider range of mark properties to be mapped:
위의 예시 코드에서 Plot을 생성할 때 미리 지정해두고,
실제로 점을 그릴 때(so.Dot()을 호출할 때), 지정된 값을 가져와 매핑한다고 한다.
기존 scatterplot()의 경우,
hue 파라미터로 전달하는 즉시, plot에 반영되는 것과는 확실한 차이점이 있다.
이 차이점 외에도 많은 차이점이 있다고 한다.
또한 objects를 사용하여 훨씬 더 광범위한 마크 속성을 매핑할 수 있다고 한다.
plot_penguins = so.Plot(
    penguins,
    x='bill_length_mm',
    y='bill_depth_mm',
    edgecolor='sex',
    edgewidth='body_mass_g'
)
color 파라미터가 사라지고, edgecolor, edgewidth가 추가되었다.
plot_penguins.add(so.Dot(color='.8'))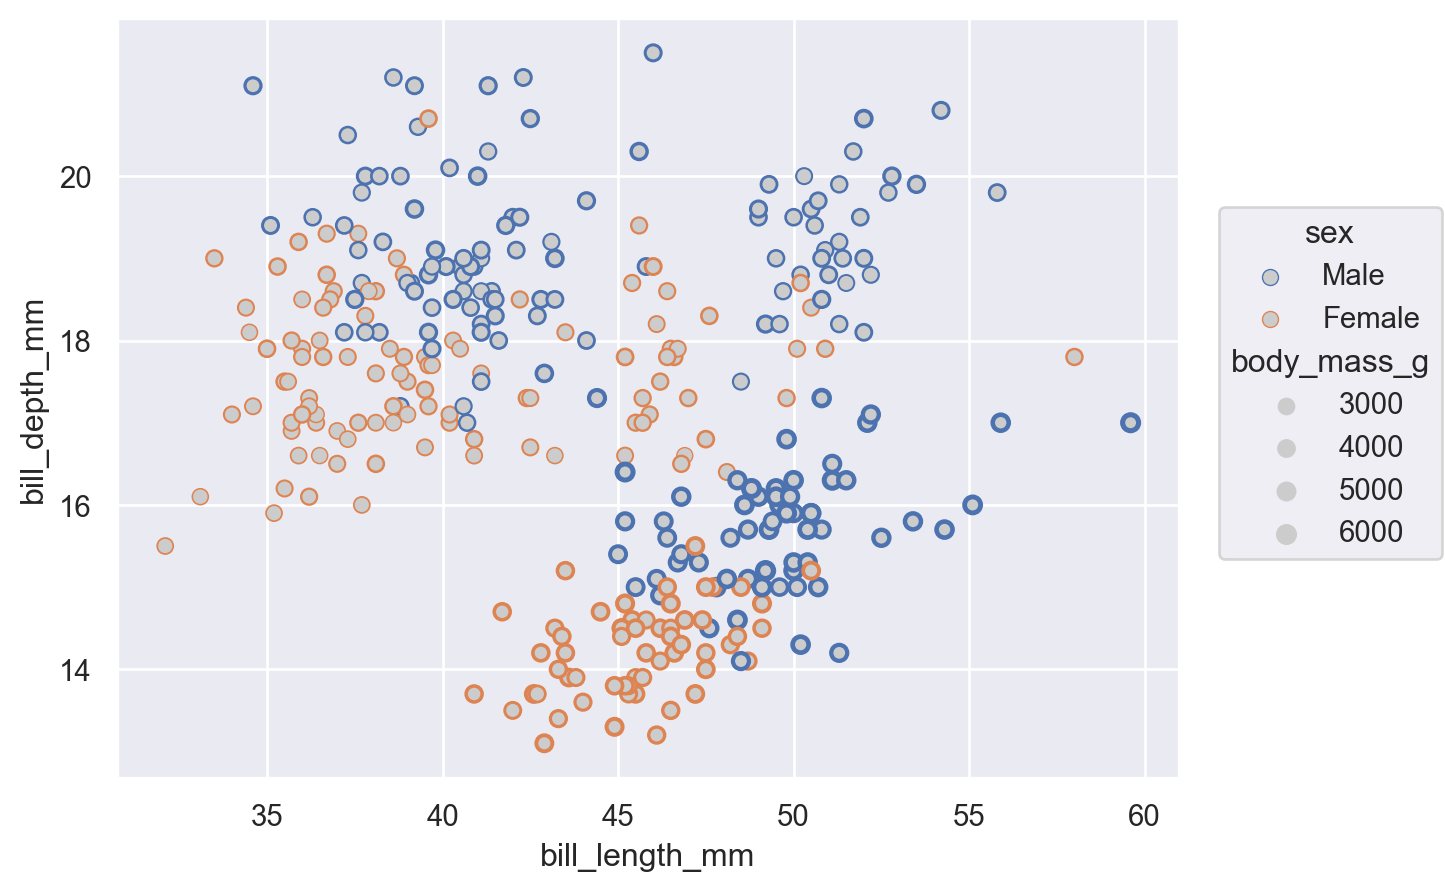
훌륭하게 그려졌다.
Defining groups
: 그룹 정의
점 표시는 각 데이터 포인트를 독립적으로 나타내므로 속성에 변수를 할당해도 각 점의 모양이 변경되는 효과만 있습니다. Line과 같이 관찰을 그룹화하거나 연결하는 마크의 경우 고유한 그래픽 요소의 수도 결정합니다.
The Dot mark represents each data point independently, so the assignment of a variable to a property only has the effect of changing each dot’s appearance. For marks that group or connect observations, such as Line, it also determines the number of distinct graphical elements:
그룹을 통해 여러개의 그래픽 요소를 하나의 그룹으로 만들어 관리할 수 있다는 이야기인 것 같다.
예시 코드를 봐보자.
새로운 데이터 세트인 healthexp를 불러왔다.
healthexp = sns.load_dataset('healthexp')
plot_healthexp = so.Plot(
    healthexp,
    x='Year',
    y='Life_Expectancy',
    color='Country'
)
plot_healthexp.add(so.Line())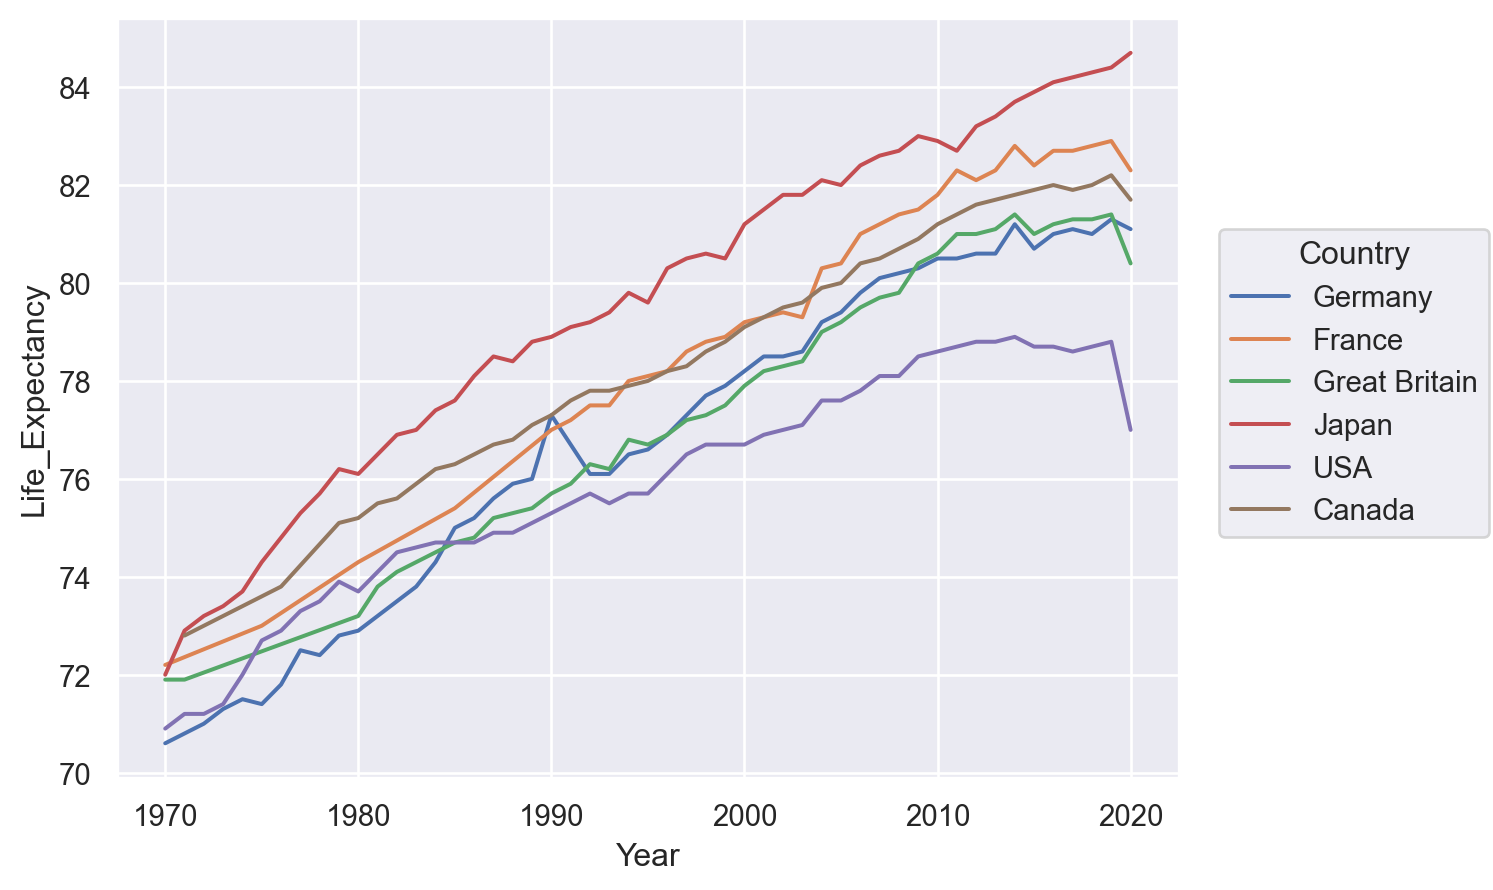
Country 마다 색상이 입혀졌다.
group을 사용하여 시각적 속성을 변경하지 않고 그룹화를 정의할 수도 있습니다.
It is also possible to define a grouping without changing any visual properties, by using group
위에서 처럼 색상을 입히지 않고, 그룹을 정의할 수 있다고 한다.
사실 이 기능이 어디에서 쓰이는 지는 아직 모르겠다. 언젠간 깨달는 날이 올 거라 믿는다.
plot_healthexp = so.Plot(
    healthexp,
    x='Year',
    y='Life_Expectancy',
    group='Country'
)
color 파라미터가 사라지고, group 파라미터가 추가되었다.
plot_healthexp.add(so.Line())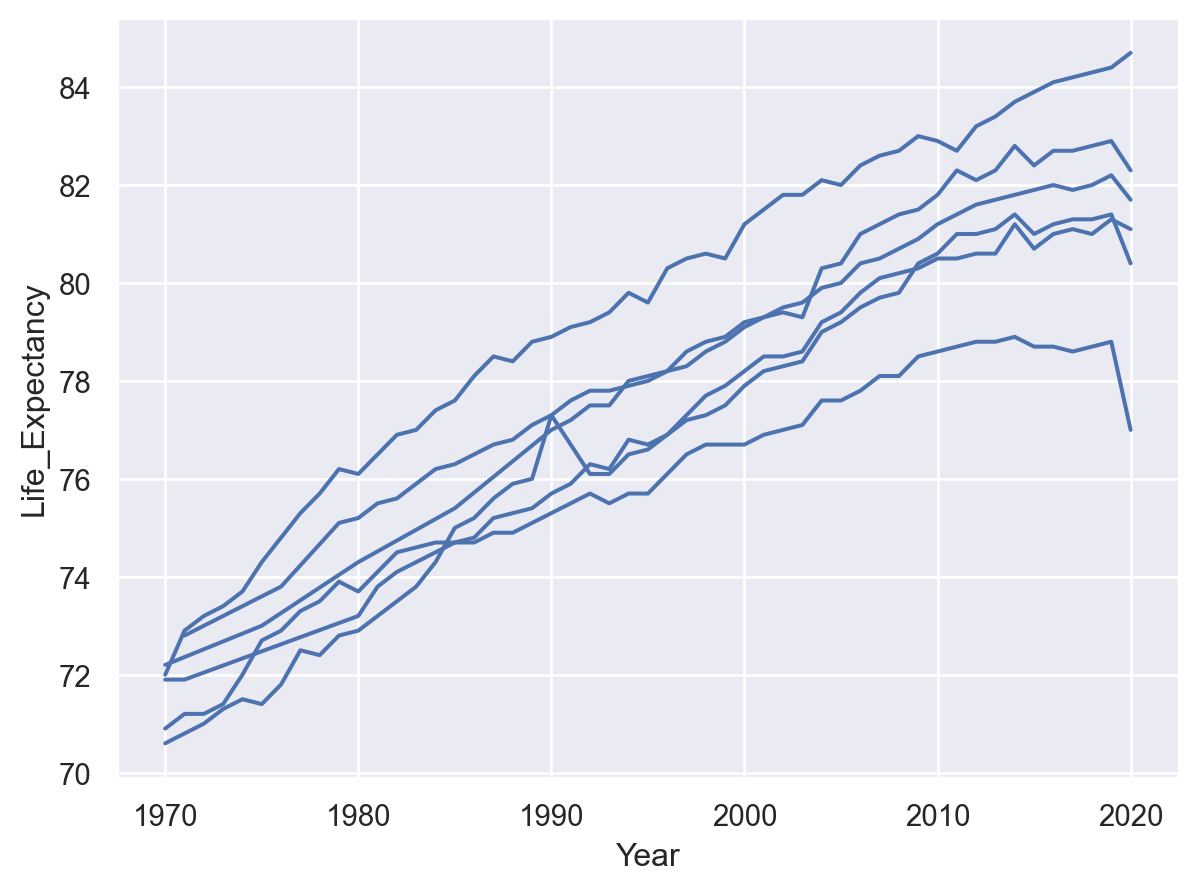
Country 마다의 색상이 사라지고, 하나의 색상으로 표현되었다.
생각보다, objects의 사용법이 간단해서 놀라웠다.
또, 기존에 플롯을 그리는 방식보다는 더 이해가 잘가는 것 같다.
기존에 플롯을 그릴 때, scatterplot()의 파라미터로 모든 것을 설정해주고,
matplotlib을 통해 부수적인 그래픽 요소를 추가하거나 수정해주었다면,
objects로 모든 것을 다 할 수 있다는 느낌을 강하게 받았다.
새롭게 업데이트된 지 얼마 안되어서, 이슈가 있을 수 있겠지만,
이 기능이 안정적으로 자리를 잡는다면, seaborn에서 헤어나올 수 없지 않을까 한다.
출처 :
User guide and tutorial — seaborn 0.12.2 documentation
https://seaborn.pydata.org/tutorial/objects_interface.html#the-seaborn-objects-interface
The seaborn.objects interface — seaborn 0.12.2 documentation
The seaborn.objects interface The seaborn.objects namespace was introduced in version 0.12 as a completely new interface for making seaborn plots. It offers a more consistent and flexible API, comprising a collection of composable classes for transforming
seaborn.pydata.org
GitHub :
MoonsRainbow/seaborn-tutorial
https://github.com/MoonsRainbow/seaborn-tutorial
GitHub - MoonsRainbow/seaborn-tutorial: Seaborn User guide and tutorial 필사 코드입니다.
Seaborn User guide and tutorial 필사 코드입니다. Contribute to MoonsRainbow/seaborn-tutorial development by creating an account on GitHub.
github.com
'기술 공부 > Seaborn' 카테고리의 다른 글
| 12) The seaborn.objects interface (2) (0) | 2023.03.16 |
|---|---|
| 10) Data structures accepted by seaborn (2) (0) | 2023.03.02 |
| 9) Data structures accepted by seaborn (1) (1) | 2023.02.23 |
| 8) Figure-level vs. axes-level functions (3) (1) | 2023.02.21 |
| 7) Figure-level vs. axes-level functions (2) (0) | 2023.02.20 |